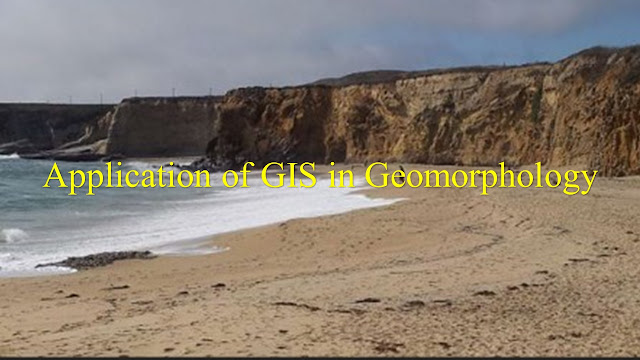
Geomorphology (from Greek: γη, ge, "earth"; μοϝφή, morfé, "form"; and λόγος, logos, "knowledge") is the scientific study of landforms and the processes that shape them. Geomorphologists seek to understand why landscapes look the way they do: to understand landform history and dynamics, and predict future changes through a combination of field observation, physical experiment, and numerical modeling. Geomorphology is practiced within geology, engineering geology, geodesy, geography, archaeology, and geological engineering. Early studies in geomorphology are the foundation for pedology, one of two main branches of soil science.
Landforms evolve in response to a combination of natural and anthropogenic processes. The landscape is built up through uplift and volcanism. Denudation occurs by erosion and mass wasting, which produces sediment that is transported and deposited elsewhere within the landscape or off the coast. Landscapes are also lowered by subsidence, either due to tectonics or physical changes in underlying sedimentary deposits. These processes are each influenced differently by climate, ecology, and human activity.
Practical applications of geomorphology include measuring the effects of climate change, hazard assessments including landslide prediction and mitigation, river control and restoration, coastal protection, and assessing the presence of water on Mars.
Visualization and analysis of spatially oriented data are the primary strengths of a geographic information system (GIS). These attributes have assisted a variety of ongoing geomorphology studies in the Oregon District of the U.S. Geological Survey. Three examples are
(1) flow modeling with LIDAR elevation data for the Snoqualmie River, Washington;
(2) determining temporal and spatial rates of channel migration for several rivers in western Washington; and
(3) calculation of sediment budget for the Deschutes River Basin, Oregon. The flow modeling application required modification of a digital raster elevation model (DEM) that did not adequately represent the channel geometry or the channel water surface. Superimposing vector topographic data on the DEM and creating a water surface for the channel resulted in a product that could be used in the flow modeling process. The channel migration study required a compilation of various statistics on channel characteristics for cross-sections at specific intervals such as cumulative length and area, width, and area of gravel deposits or riparian vegetation. Additionally, historical maps were digitized into the GIS, which easily allowed distance and direction of migration over time to be measured along cross-sections. For the Deschutes River Basin, a spatially explicit map of relative sediment production was created in the GIS for use in assessing the effects of the Pelton-Round Butte dam complex on the lower Deschutes River channel. The entire basin was divided into 100 approximately equal hydrologically based units. For each unit, the average slope and drainage density were computed and used to calculate the relative potential for sediment production.


.jpg)


1 Comments
Nice article
ReplyDelete